Fishbone Diagrams Graphic Means of Figuring Out the Components of a Problem
Fishbone diagrams: Popularized in the 1960s by Kaoru Ishikawa, who pioneered quality management processes in the Kawasaki shipyards. In the process he became one of the founding fathers of modern management. So they are sometimes called Ishikawa Diagrams. They are causal diagrams to show the causes of a specific event.
Fishbone diagrams are more properly called cause and effect diagrams, are an excellent tool from the Quality Management process. Do not allow the amazing simplicity fool you. You need pencil and paper or a whiteboard if you are working in a group. Team creativity will give you best results, especially if you use brainstorming.
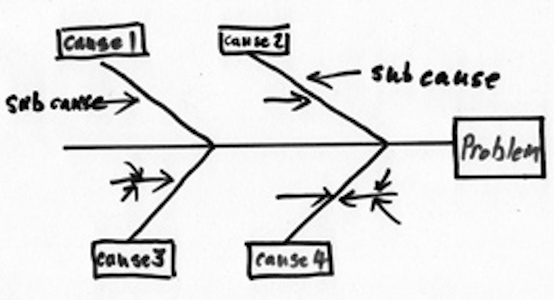
Feel free to draw fishbone diagrams in your own styIe. I have drawn one freehand, so as not to daunt you with pretty graphics. To start with, set down the problem to be solved, then draw the basic fishbone. You may have as many obvious causes as you like, but you will probably find that there are only a few main ones, so put them in boxes.
On fishbone diagrams, you can label the causes
- Machine,
- Method,
- Materials,
- Measurement,
- Man, or
- Mother Nature (Environment), for example.
An alternative for any of the causes could be
- Equipment,
- Process,
- People,
- Materials,
- Environment, or
- Management.
In less of a production-oriented situation the causes on fishbone diagrams could be
- Price,
- Promotion,
- People,
- Processes,
- Place,
- Policies,
- Product/Service.
You then brainstorm sub-causes and even sub-causes on sub-causes, and your fishbone diagram will get to look more and more like a fish skeleton. Do not hold back from the wildest speculations about causes. You can always eliminate them later.
The applications include working on
- identifying areas for data collection
- dwindling sales
- product returns
- a website that fails to attract business
- a problem/issue to determine the root cause
- reasons why a process is having difficulties, problems, or breakdowns
- a process not performing properly or producing the desired results
- and many more…
My experience of using fishbone diagrams is that, quite often you find you have picked the wrong problem to work on. For example, if you are working on poor sales, it may turn out that the real problem is that the product is wrong. On the other hand, you may have asked enough ‘whys’ to realize that you should be working on one of the sub-causes because that it is the real root cause. If not, try the Five Whys Technique.
Do not be deterred from doing ‘fishbones on fishbones’. Above all, have fun and don’t lose heart. It may take a while to get the hang of it, but it really works.
There are many software applications to produce a fishbone diagrams, both for Mac and MS. Several are free, such as Canva, that has many other useful diagrams and you might be happier using them if your freehand drawing skills are as bad as mine!
